Data Driven Docs? #
It’s a powerful library with a bit of a learning curve.
There a heck lot of things it can do. Nice confusion. These might be some good resources:
- An updated D3 tutorial (This was the best!)
- Official tutorial (It can take some time to get used to observableHQ’s notebooks)
- Huge collection of tutorials
- https://wattenberger.com/blog/d3#intro
[SUGGESTION]: Do the d3indepth tutorial first and practise a bit by trying to make your own visualizations. The other resources can be useful when you’re stuck.
SVGs #
This is one popular way to display graphics onto a webpage. It’s the one that most D3 visualizations use.
There are already good resources available online. Check them out:
- Kevin Powell’s guides on YouTube
- Understanding SVG by Sara Soueidan - this is a series of 3 articles, at the end of this one there’s a link to the next one. They’re pretty deep and help you understand what’s really going on.
Selection #
One feature of d3 is the ability to select and modify the DOM.
Core to this are select and selectAll which take in an HTML Element or a CSS selector.
Both return a Selection object.
API for selecting and selections.
Properties #
The object has a few functions, each of which return a Selection object
(that means chaining is possible)
| Function | Params | Description |
|---|---|---|
| style | ‘css-prop’, value | Sets a css property |
| attr | ‘html-attr’, value | Sets an attribute on the HTML element |
| classed | ‘classname’, value | Removes or adds class depending on value |
| property | ‘html-prop’, value | Sets HTML attributes which can’t be set by ‘attr’. E.g. checked on a checkbox |
| text | value | Sets the text within a HTML element |
| html | value | Sets HTML within the selected element |
| select | CSS selector | Can be used to select child elements |
value can be an actual value or a function. The function takes in two params:
dthe datum, which is the data value corresponding to the indexithe index of the element among other elements in the Selection.
Its possible to add an event to the Selection with the on property like so:
d3.select('rect')
  .on('hover', function(event, datum) { // can be any DOM event
    // `this` inside this function refers to the HTMLElement
    // to get a d3 Selction from it you must do d3.select(this)
  });
Because of the way
thisworks inside arrow functions, don’t use arrow functions for the callback ofonif you want to usethis.When it comes to D3, it might just be a good idea to use
functionfor most use cases.
Insertion / Deletion #
Its possible to insert / remove DOM elements with D3. The functions are:
.append('element-tag')creates the specified element as the last child of the selection.insert('element-tag', 'css-selector')same as append but it places this element before the CSS selector specified.removeremoves the element(s) in the Selection from the DOM
Processing #
A Selection can be processed in these ways:
.each(function(d, i){}calls the function for each element..call(function(theSelection){})calls the function once for the selection. It passes the selection object as an argument..filter(function(d, i){})calls the function for each element. It returns a new selection that only contains elements that returned true in the filter function..sort(function(datumA, datumB){})sorts the elements in the DOM with the comparator function.
Data Joins #
Modifying visual elements according to data in a declarative manner. It usually works like this:
- Create a Selection of the parent element which will hold the visual elements.
- Create an empty Selection with
.selectAll('element-to-join'). - Create a Selection with data by calling the
datamethod on it with an array as the argument. - On the latest selection call
.join('element-to-insert')
Article to help with understanding joins. Another article. This one’s about modern joins
Selection Join #
This join automatically appends and removes elements but also provides the ability for fine control. A sample:
d3.select('g')
  .selectAll('circle')
  .data(array)
  .join('circle')
  .attr('fill', 'blue');
To control what happens to enter, update and exit elements, pass functions as args to it like so:
selexon.join(
  function(enterSelection){},
  function(updateSelection){},
  function(exitSelection){}
)
Keys #
It’s possible to make sure that DOM elements are exactly matched with the same data even if the elements are moved around. This is possible via a key function which assigns keys to DOM elements based on the data they get like so:
xyz.data(array, function(d){ /* return unique id */ })
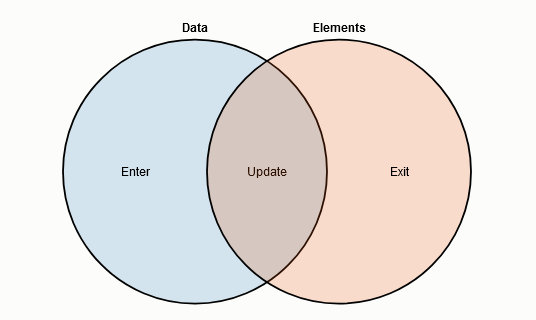
Enter, Exit & Update #
This picture from
https://bost.ocks.org/mike/join/ is a good explanation:
This way of joining is fine-grained but it can be tedious. It’s mainly used for transitions. A more concise way is using the new selection join (D3 v5+).
An example. Given a DOM like:
<svg>
  <g>
    <circle></circle>
    <circle></circle>
  </g>
</svg>
Circles can be selected like so:
let data = [10, 8, 15];
let circs = d3.select('g').selectAll('circle');
Existing elements can be joined with data like so:
circs.data(data).attr('r', d => 2*d);
New elements can be created for extra datum:
circs.data(data).enter().append('circle')
Elements which don’t have a datum:
circs.data(data).exit()
Scales #
Scales provide a way to map values from a domain to a range. They can be continuous or discrete. (There’s no scale for D to C though).
Usually the domain consits of data values and the range consists of visual properties (height, position, color, etc.)
C to C #
There are many scales here: Linear, Quadratic, Log, Exponential, etc. An example:
let scale = d3.scaleLog();
scale.domain([1, 100]);
scale.range([0, 1]);
let scaledVal = scale(50);
For fancy colors there’s also d3.scaleSequential() which instead of a range, has an interpolator.
E.g. scale.interpolate(d3.interpolateRainbow)
C to D #
A straightforward function is .scaleQuantize() which splits the domain into equal divisons among the range.
It also clamps inputs into the domain.
To split the domain into specific groups .scaleThreshold() can be used.
.domain([/* array of n values */]) will create n+1 groups (<arr[0], >arr[0] & arr[1]<, … arr[n-1]<).
They are matched one-one with the range items. If there aren’t enough elements in the range,
the groups are allocated to the last item.
D to D #
The simplest way to do this is .scaleOrdinal() where the elements in domain are allocated on range element.
If there aren’t enough range elements the array repeats.
If the value to be scaled doesn’t exist in the domain, the scale will automatically add it.
To prevent it from being added, specify a default value to be returned for unknown elements with
scale.unknown(value)
There are other functions too like .scaleBand() and .scalePoint().
Shapes & Lines #
D3 has generator functions to generate paths that represent line graphs, pie charts, curves, and more.
This works using the <path> SVG tag and setting its d (data) attribute to a special strings
returned by the functions which contain instructions on how to draw the required shapes.
Common generators #
| Name | Description | Configurable params |
|---|---|---|
line |
Simple line graph | x, y for each point in the line |
radialLine |
Like a line graph but instead of going left to right, it goes around a center | angle, radius for each point around the center |
area |
Area between two lines (need not be straight lines) | x, y0 for top line, and y1 for bottom |
radialArea |
Like how radialLine is to line | angle, innerRadius, and outerRadius |
The configurable params can either be a function that takes in one value and returns a value,
or it can be a value. E.g. lineGenerator.x(909) and lineGenerator.x(d => d+10) both work.
Example usage:
let inputData = [/* complex objects */]
let lineGen = d3.line();
lineGen.x(arrayVal => arrayVal.prop1 + 10)
lineGen.y(arrayVal => arrayVal.prop2 - 5)
let pathData = lineGen(inputData);
d3.select('path').attr('d', pathData)
Instead of passing an array of objects and configuring each param, the user can also just feed an array of arrays to the generator.
To handle invalid data in the array, the user can set .defined(datum => {}) on the generator.
D3 will skip the element if the callback function returns false for it.
Interpolation of the points can be changed by calling .curve(someCoolCurveGen) on the generator.
Check out some popular curves
in the docs.
Axes #
These help give the user a scale of the data. An axis can be created in a container like <g>.
Select the container. Create an axis with .axis[Left|Right|Top|Bottom](scale).
The scale’s domain determines the ticks on the graph and the range helps determine its length.
The axis can then be passed to the container Selection like so: gSel.call(axis). That’s it!
It isn’t limited to uniform ticks. Different scales like .scaleSqrt() can be used with axes.
To make the axis look better, the domain can be rounded to “nice” values like so:
d3.scaleLinear().domain([11, 39]).nice() will change to domain to (10, 40).
The number of ticks can be changed by axis.ticks(n) or even set tick values like
axis.tickValues([a, b, c, d]). The label of each tick can be formatted with something like
.tickFormat(d => "-"+d)
Hierarchies #
There are multiple layouts here such as tree, cluster (just like a tree but all the leaves are on the same horizontal level), treemap, and so on. This section will focus on the tree layout.
It uses the output of d3.hierarchy, a nested object, to layout the tree.
hierarchy itself needs a nested object as input or a map of maps.
hierarchy
#
Given an input with the format discussed above, hierarchy returns a nested object
where each object (node) has the following params:
data: The item in the input data that this node is associated with. E.g. a map key and its value.children: array of references to children (not present in leaf nodes)depthheightparent: reference to parent node
It also has methods like:
descendants: Returns an array of all its descendantsancestors: Returns an array of all its ancestorslinks: Returns an array of all links under this subtree. A link looks like
{
  source: reference to source node object,
  target: reference to target node object
}
Tree Layout #
A tree layout function can be created like so: let funk = d3.tree().
The size this element will take in the DOM can be set like so: funk.size([ht, wd]).
The layout can then be applied to the hierarchy object like so: funk(hierarchyOutput).
The tree’s size need not be set explicitly, instead, a combination of .nodeSize([ht, wd]) which
sets the minimum space a node must be alloted, and .separation((a, b) => 1) which sets the
the space between two nodes in terms of nodeSize
(e.g. 3 means a and b will be separated by the space that 3 nodes would occupy)
Applying a layout means it will add extra properties (display properties e.g. x and y locations) to each node in the hierarchy.
Now that the object has display properties, it can be used to create DOM nodes and position them.
Nodes #
Use the rootNode.descendants() array along with a join for whatever shape you like (e.g. “circle”).
Edges #
Use the rootNode.links() array along with a join which creates lines with “path”.
Transitions #
When data gets updated, elements might have new places, might look different, or even vanish. Without smooth transitions, the transitions looks janky and not “natural”.
To have a transition just call transition() on the Selection before calling any attr methods
for which you want a transition.
Could be position (e.g. ‘x’, ‘cx’), color (e.g. ‘fill’), or even size (e.g. ‘r’). It creates a transition Selection which has a few more methods and it automatically creates a transition when the join runs.
A delay can be added by calling delay(durationInMilli).
A duration for the transition can be set with duration(durationInMilli)
Instead of setting a constant duration both the functions can take a callback function
which can set determine the value according to some factor e.g. (d, i) => i*1000
Calling transition() a second time in the Selection chain will cause the second one to play out
after the first one has finished.
To put separate transitions for enter, exit, and update elements, use separate functions for the join
and apply transition() within them where required. E.g.
coolSelection.join(
  function(enterSelect) {
    enterSelect.transition()
      .attr('r', d => d+10)
  },
  function(updateSelect) {
    updateSelect.transition()
      .attr('fill', 'green')
  },
  function(exitSelect) {
    exitSelect.transition()
      .remove()
  }
)
There are other topics too but this should be enough to get started.